
Railway Investigation Report R15M0034
Main-track derailment
Canadian National Railway
Freight train M30511-17
Mile 212.8, Napadogan Subdivision
Saint-Basile, New Brunswick
The Transportation Safety Board of Canada (TSB) investigated this occurrence for the purpose of advancing transportation safety. It is not the function of the Board to assign fault or determine civil or criminal liability. This report is not created for use in the context of legal, disciplinary or other proceedings. See Ownership and use of content.
-
Table of contents
Summary
On 17 April 2015, at approximately 1450 Atlantic Daylight Time, westbound Canadian National Railway freight train M30511-17, travelling at 46 mph, derailed 35 rail cars and 1 distributed power locomotive at Mile 212.8 on the Napadogan Subdivision, near Saint-Basile, New Brunswick. The derailment destroyed approximately 900 feet of main track. Twenty of the derailed rail cars were residue tank cars that had last contained crude oil (UN 1267, Class 3). There were no leaks and no injuries.
Le présent rapport est également disponible en français.
Factual information
1.1 The accident
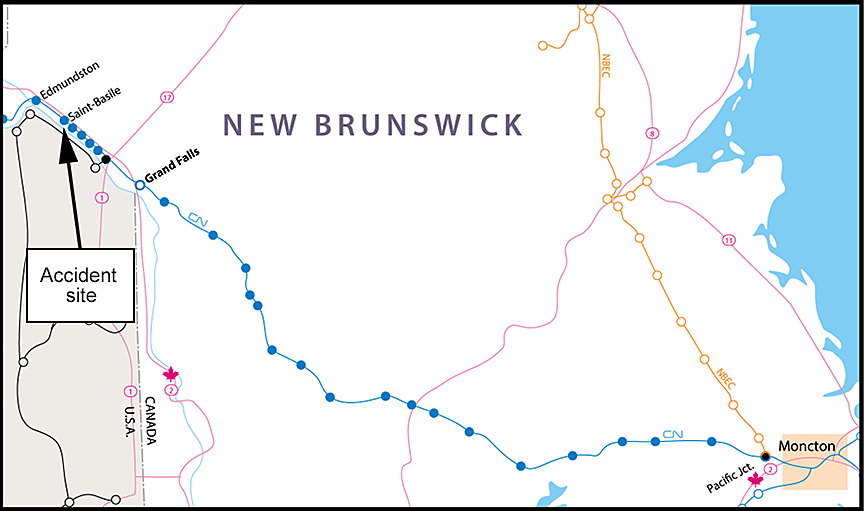
On 17 April 2015, at approximately 1450,Footnote 1 westbound Canadian National Railway (CN) freight train M30511-17, from Moncton, New Brunswick, was travelling on the Napadogan Subdivision destined for Toronto, Ontario. The train was proceeding at 46 mph when it derailed 35 cars and 1 distributed power (DP) locomotive at approximately Mile 212.8, near Saint-Basile, New Brunswick (Figure 1).
The train was powered by 2 head-end locomotives interconnected with 1 DP locomotive. The DP locomotive was located about 6300 feet from the head end of the train, with about 4900 trailing tons. The train was composed of 160 cars, including 114 loaded cars, 6 empty cars, and 40 residue tank cars. The train was approximately 12 000 feet in length and weighed approximately 11 200 tons.
The train crew consisted of a locomotive engineer and a conductor. Both crew members were qualified for their respective positions, met rest and fitness standards, and were familiar with the subdivision.
1.2 Site examination
The derailment occurred in a rural area adjacent to Highway 144 (Figure 2). In this area, the track runs along the Saint John River that forms the international boundary between Canada and the United States. The derailed cars came to rest on both sides of the track, and many of the cars slid down the embankment toward the Saint John River.

During site examination, the following was noted:
- The head-end locomotives and the first 60 cars had separated, and the 60th car came to a stop on the main track approximately 1500 feet west of the derailment site.
- The 61st to 95th cars had derailed (Photo 1 and Photo 2). The last derailed car was in position 95
- The trailing 65 cars (that is, positions 96 to 160) of the train consist had remained on the track.
- The derailed cars consisted of 5 centre beam flat cars carrying lumber, 1 flat car carrying wallboard, 8 box cars carrying paper, 20 residue tank cars (Class 111) that had last contained petroleum crude oil (UN 1267, Class 3), and 1 empty hopper car
- The DP locomotive, which was located between the 65th and 66th cars, derailed and came to rest with its leading end near Mile 212.87.
- The derailment destroyed about 900 feet of track, extending from Mile 212.93 to Mile 212.76.


1.3 Derailed equipment
The derailed cars that had been positioned ahead of the DP locomotive (that is, the 61st to 65th cars) came to rest in a line on their sides on the north side of the track (Table 1). The 61st and 62nd cars were detached from the others, whereas the 63rd to 65th cars, as well as the DP locomotive, came to rest coupled to each other.
| Consist position | Initial and number | Equipment type |
|---|---|---|
| 61 | CN 624072 | Bulkhead flat car (centre beam) – loaded with lumber |
| 62 | DWC 627099 | Bulkhead flat car (centre beam) – loaded with lumber |
| 63 | CNA 623013 | Bulkhead flat car (centre beam) – loaded with lumber |
| 64 | GTW 623676 | Bulkhead flat car (centre beam) – loaded with lumber |
| 65 | AOK 27626 | Bulkhead flat car (centre beam) – loaded with lumber |
| DP | CN 8954 | DP locomotive (EMD SD70M-2) |
The 61st car (CN 624072) was travelling with its B-end leading. The leading truck was still attached to the car. There was a shiny contact area noted on the body side bearing at the same end, on the right side (BR location). Because the bearing surfaces are in contact, they will rub and wear; as a result, they can polish. The trailing truck (A-end) was located approximately 30 feet behind the car. Its components were still assembled. The coupler housing on the trailing end of the car was deformed, with the coupler rotated in a clockwise direction. The plates of the wheels in the trailing truck showed significant scuffing, typically associated with contact with track ballast (Photo 3).

The 62nd car (DWC 627099) was travelling with its A-end leading. The car came to rest separated from the other cars. The trailing truck was behind the car on the same (north) side of the track. It was mostly disassembled, with its wheels, springs, and other truck parts strewn about the derailment site. The R-1 wheel had marks on the outboard face of the tread (Photo 4).


There was a heavy mark on the body centre plate on the trailing end of the car (B-end). The marks extended from the centre-pin hole toward the end of the car and slightly toward the south (Photo 5). There were also uneven contact surface marks on the body side bearing at the same end, on the left side (BL location). The coupler housing on the trailing end was broken horizontally on the north side of the opening. There was no indication of significant coupler shank twist at this end.
There were scratches on the bottom of the truck side frame on the B-end of the 62nd car (Photo 6 and Photo 7).


The knuckle on the leading end of the 63rd car (CNA 623013) was broken. The 65th car (AOK 27626) had a bent truck side frame pedestal jawFootnote 2 at the L-3 location. There was also significant damage to a pedestal jaw on the B-end truck.
| Detector location | Date and time | Actual WILD reading (kips) | CN speed-corrected reading (kips) | Train speed at site |
|---|---|---|---|---|
| Alward, NB | 17 Apr 2015 – 0958 | 69.8 | 75.3 | 37.3 mph |
| Derailment | 17 Apr 2015 – 1450 | |||
| Bagot, QC | 18 Apr 2015 – 1716 | 84.3 | 84.3 | 53.8 mph |
| Cedars, QC | 18 Apr 2015 – 2148 | 72.2 | 79.4 | 33.9 mph |
| Clarke, ON | 19 Apr 2015 – 0338 | 91.9 | 91.9 | 53.7 mph |
1.4 Weather
At the time of the occurrence, the sky was cloudy and the temperature was 17 °C. Local weather stations had recorded humidity of 28%, with winds from the west at 19 km/h (gusting up to 29 km/h).
1.5 Subdivision information
The Napadogan Subdivision consists of a single main track that extends from Pacific Junction near Moncton (Mile 0.0) to Edmundston, New Brunswick (Mile 219.40). Train movements are governed by the centralized traffic control system, as authorized by the Canadian Rail Operating Rules, and supervised by a rail traffic controller located in Montréal, Quebec. The track is Class 4 track according to the Transport Canada (TC)–approved Rules Respecting Track Safety, also known as the Track Safety Rules (TSR).Footnote 3 Between Mile 209.8 and Mile 219.4, the zone speed was 50 mph for freight trains. The subdivision carried an annual average tonnage of 18 200 000 gross tons.
1.6 Track information
In the vicinity of the derailment, the track consisted of 136-pound RE continuous welded rail laid on 14-inch double-shouldered tie plates secured with 4 spikes. The rail at every second tie was box-anchored. There were approximately 3200 hardwood ties per mile of track. Between Mile 212 and 213, there were approximately 1050 new Number 1 ties that had been installed in October 2014. The ballast consisted of crushed rock, and the cribs were full.
In the direction of travel, the train was traversing a 3-degree right-hand curve on a maximum 0.3% descending grade. The curve had the following characteristics (Table 3).
| Characteristic | Value |
|---|---|
| Length | 1386 feet |
| Maximum curvature | 3.11 degrees at Mile 212.825 |
| Minimum elevation | 2.68 inches at Mile 212.826 |
The rail on the north (low) side of the curve was HH VT Nippon, manufactured in December 2007. This rail had minimal wear. The rail on the south (high) side of the curve was RE Sydney, manufactured in January 1992. On the south rail, the maximum combined rail wear (that is, vertical wear as well as gauge wear) was 1 9/32 inches (33 mm). Before the derailment, the south rail had been scheduled for replacement in summer 2015.
At CN, the rail wear limits for 136-pound rail were specified as a maximum vertical wear of 7/8 inch (23 mm), a maximum gauge wear of 5/8 inch (16 mm), or a maximum combined rail wear of 1¼ inches (31 mm). Table 4 shows the combined rail wear on the south rail (near Mile 212.82), as recorded during the 4 most recent track evaluation system (TEST) car inspections.
| Date | Combined rail wear, south rail (mm) | Length of wear (feet) |
|---|---|---|
| April 2015 | 33 | 654 |
| October 2014 | 31 | 525 |
| August 2014 | 30 | 324 |
| May 2014 | 29 | Sporadic |
TEST car measurements can overestimate the amount of rail wear, and results need to be field-validated. Following the April 2015 TEST car inspection, field measurements taken at the derailment location by CN were reported as a maximum of 29 mm combined rail wear.
1.7 Track inspections
The railway track inspection program consists primarily of visual inspections, rail flaw inspections, track geometry inspections, and special inspections in extreme weather conditions.
1.7.1 Visual inspections
The TSR prescribe minimum requirements for the frequency and manner of track inspections to detect deviations. For Class 4 track, the minimum frequency for visual inspections is twice weekly, regardless of the annual tonnage transported. The most recent visual inspection for the track between Mile 210 and Mile 214 was performed by CN on 16 April 2015, with no defects noted. TC had last inspected the track in the derailment area on 11 December 2014, with no non-compliance with the requirements of the TSR noted.
1.7.2 Track geometry inspections
1.7.2.1 Canadian National Railway track evaluation systems car inspections
Track geometry inspections are automated inspections using instrumented vehicles to measure and evaluate track geometry under load. The minimum frequency for these inspections is specified in the TSR; for Class 4 tracks with 15 000 000 to 35 000 000 annual gross tonnage, the minimum frequency when using a “heavy geometry inspection vehicle”Footnote 4 or TEST car is twice annually.
Between 07 May 2014 and 15 April 2015, CN conducted 4 track geometry inspections on the Napadogan Subdivision using one of its TEST cars. During these inspections, the measurements were based on the dynamic forces generated while the TEST car was travelling at track speed. Figure 3 shows the recorded data between Mile 212.8 and Mile 212.9 from the 15 April 2015 inspection.

1.7.2.2 Track gauge and surface conditions
During the April 15 inspection, the TEST car identified several defects in the derailment curve (Table 5), including a near-urgentFootnote 5 wide-gauge defect and 2 priority surface defects at Mile 212.82.
| Track condition | Defect category | Length (feet) | Maximum value () | Mile |
|---|---|---|---|---|
| Wide-gauge defect | Priority | 2 | 57 3/8 inches (0.853) | 212.823 |
| Wide-gauge defect | Near-urgent | 4 | 57 7/16 inches (0.924) | 212.823 |
| Wide-gauge defect | Priority | 2 | 57 3/8 inches (0.868) | 212.822 |
| Left profile | Priority | 8 | −1.215 inches | 212.824 |
| Right profile | Priority | 9 | −1.431 inches | 212.824 |
At the derailment location, the following gauge conditions had been identified in the previous 3 TEST car inspections (Table 6).
| Inspection date | Track condition | Defect category | Length (feet) | Gauge (inches) | Mile |
|---|---|---|---|---|---|
| 07 May 2014 | Wide-gauge defect | Urgent – Repeat* | 10 | 57 11/16 | 212.824 |
| 15 Aug 2014 | Wide-gauge defect | Urgent – Repeat | 11 | 57 9/16 | 212.828 |
| 21 October 2014 | Wide gauge | Not applicable | 0 | 57 3/16 | 212.826 |
| * Repeat defects are near-urgent and urgent defects that have not been corrected since the previous TEST car inspection. | |||||
In North America, the standard track gauge is 56 ½ inches. According to the TSR Part II, Subpart C – Track Geometry, the maximum gauge for Class 4 track is 57 ½ inches. For track-surface conditions, the deviation from uniform profile on either rail at the mid-ordinate of a 62-foot chord may not be more than 2 inches. In this occurrence, the derailment curve had been gauged in 2014 after new ties were installed. A subsequent TEST car inspection of the curve indicated an average gauge of about 57 inches, with one location being 57 3/16 inches.
For Class 4 track, the CN Engineering Track Standards (ETS) specify that
- 57 ¼ inches is a priority wide-gauge defect;
- 57 ⅜ inches is a near-urgent wide-gauge defect;
- 57 ½ inches is an urgent wide-gauge defect; and
- rail surface tolerances are 2 inches for urgent surface defects and 1 inch for priority surface defects.
CN instructions specify how track forces must respond to near-urgent defects, priority defects, or combinations of priority defects. These instructions include the following:
- Near-urgent defects are to be inspected within 72 hours, and remedial action is to be taken within 30 days.
- Priority defects must be monitored until they are repaired to ensure they do not escalate into urgent defects
The following approach is to be used in responding to PRIORITY defects and combinations of PRIORITY defects:
- address combination defects (i.e. defects within 100' of each other) in the following order;\
- combination defects on curve spirals
- combination defects on curve body
- combination defects near changes in track modulus (i.e. near bridges, crossings, turnouts, etc.)
- address all other PRIORITY defectsFootnote 6
1.7.2.3 Combination defects
The TSR, Part I – General, 3. Scope, 3.2 states the following:
The rules specify the limits of certain track conditions existing in isolation. A combination of track conditions, none of which individually amounts to a deviation from the requirements in these rules may require remedial action to provide for safe operation over the track.Part II, Subpart C – Track Geometry, 8. Combined Alignment and Track Surface Deviations states the following:
A railway company must have defined measures to address the combination of track defects. Although the current TSR prescribe limits on geometry variations existing in isolation, it is recognized that a combination of alignment, and surface variations, none of which individually amounts to a deviation from the requirements of TSR may pose a higher risk when these defects are located at or near the vicinity of each other.In addition to identifying individual track defects, the CN TEST car inspection vehicle generates a combination defect report (CDR). This report shows the combinations of gauge, alignment, or surface priority defects that occur within 100 feet of track. Any two of these defects are reported on the CDR. For the inspection conducted on 15 April 2015, the near-urgent wide-gauge defects and the priority surface defects detected at Mile 212.82 were identified in the CDR.
1.7.3 Curve superelevation
The CN standard for curve superelevation is RM-1305, which specifies (in part)
- The maximum superelevation that can be applied on a curve has to be the balanced superelevation or 5 inches, whichever is less.
- The minimum superelevation that can be applied on a curve shall be the greater of ½ inch, 2 inches below the balanced elevation for freight timetable speed, 3 inches below the balanced elevation for passenger timetable speed, or 6 inches below the balanced elevation for LRC (Light Rapid Comfortable) timetable speed. The elevation can be anywhere within this range.
Based on these standards, the following operational considerations applied to the curve in this occurrence:
- The minimum superelevation for 50 mph on a 3.11-degree curve would be the balanced superelevation of 5.4 inches less 2 inches or 3.4 inches. With a minimum superelevation of 2.68 inches, the equilibrium speedFootnote 7 was 35 mph. At 2.68 inches of actual superelevation and 2 inches of superelevation imbalance, the design speed was 46.4 mph.
- For a speed of 46 mph, the balanced superelevation of a 3.11-degree curve is 4.6 inches. To operate at this speed, the minimum superelevation on the curve would be the greater of 0.5 inch, or 4.6 inches less 2 inches or 2.6 inches.
Trains travelling faster than equilibrium speed will cause accelerated wear on the high rail.
1.7.4 Lateral and vertical forces at the wheel–rail contact
There is a combination of lateral forces and vertical forces at the wheel–rail contact. The ratio of lateral-to-vertical (L/V) forces provides an indication of the likelihood of a derailment. The traditional L/V threshold for rail rollover on a loaded car is 0.65. If the resultant force acts beyond the outer edge of the rail base, rail rollover can occur (Figure 4).

1.7.5 Effect of wheel contact on rail stability
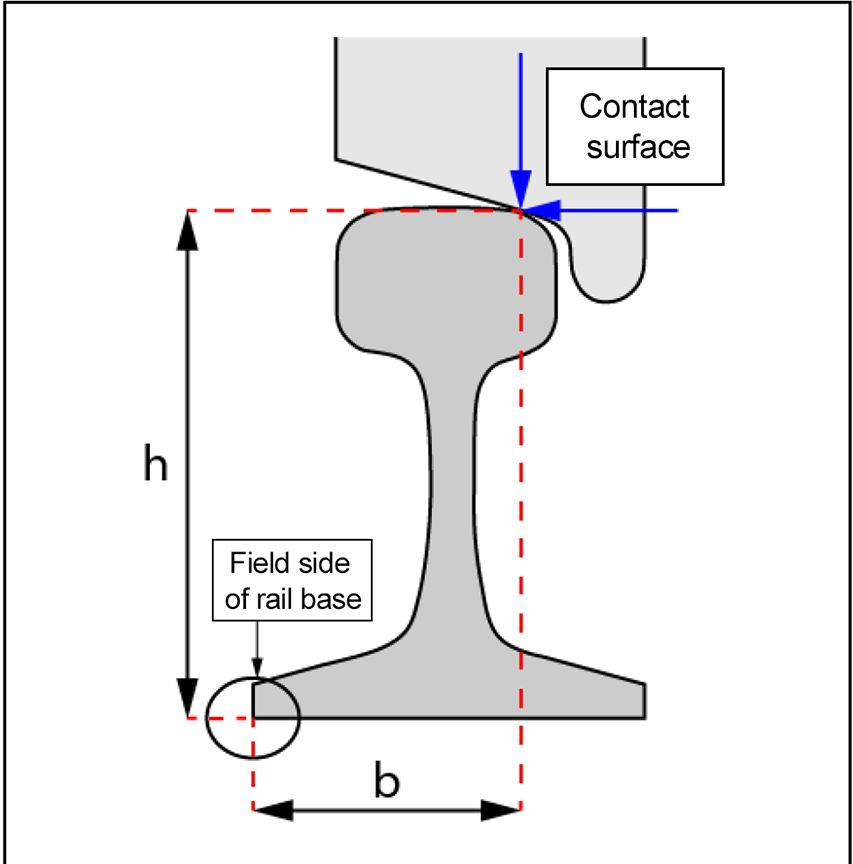
The lateral stability of a rail is linked to its b/h ratio (Figure 5). The b/h ratio represents the lateral dimension to the field side of the rail base relative to the height of the contact surface.Footnote 8 Under equilibrium conditions, just before the rail starts to rotate and roll over, the resultant force created by the lateral and vertical forces acts at the field side of the rail base.
Under normal circumstances, the wheel-to-rail contact surface is located at the inner gauge corner of the rail head. When the wheel load is shifted toward the field side, b decreases and b/h decreases. The b/h ratio can vary from greater than 0.6 for contact at the gauge side to approximately 0.2 when the contact surface shifts toward the outer edge of the rail base (the field side), as shown for the L-1 wheel of the 62nd car (Photo 8).

1.7.6 Situations affecting lateral and vertical forces in curves
In curves, the following situations affect the lateral and vertical forces:
- When there is wear on the gauge face of the high rail, 2-point contact between the wheel and the rail can occur when flanging around the curve. Wheel load that is shifted toward the field side of the rail reduces the lateral stability of the rail, lowering the L/V threshold for rail rotation or rollover.
- The wheel flanges, centrifugal forces, and frictional curving forces of wheel truck assemblies exert lateral force on the high rail. In-train forces (buff and draft forces) can also exert lateral force on the track.
- As lateral forces act to tip the rail over, the rail is restrained by its torsional stiffness and by the weight on adjacent wheels.
- Raising the high rail (superelevation) compensates for centrifugal force by shifting some car weight to the low rail, reducing the lateral force (centrifugal) and the vertical force on the high rail.
- Lubricating the gauge side of the low rail reduces frictional curving forces that can cause high rail rollover or low rail wheel drop-in.
- For a wheel to drop in, there must be either a significant increase in lateral load on the track or a significant reduction in lateral strength of the track.
1.7.7 Rail flaw inspections
The minimum frequency for rail flaw inspections is prescribed by the TSR. For Class 4 track that has annual tonnage between 15 000 000 to 35 000 000 gross tons, these inspections must be conducted twice annually, with no more than 225 days between inspections. Before this occurrence, 6 rail flaw inspections had been conducted between Mile 210 and Mile 214 between 01 January 2015 and 20 April 2015. These inspections did not reveal any rail flaw defects near the derailment location.
1.7.8 Limitations of ultrasonic rail-defect testing
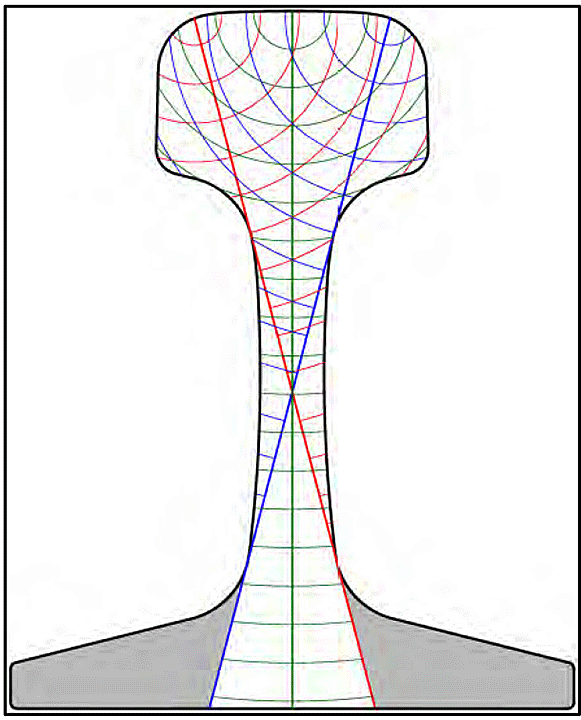
The Association of American Railroads (AAR) has determined that some defects in the base of the rail on either side of the web cannot be detected because they are outside the reflective field of current ultrasonic testing (UT) techniques (Figure 6).
A report prepared by the Transportation Technology Center, Inc. (TTCI) in 2014 for the Metro-North RailroadFootnote 9 stated:
UT, while highly accurate, is not perfect. According to the American Railway Engineering and Maintenance of Way Association (AREMA): “100 percent accuracy in testing is not within the capabilities of current equipment.”Footnote 10
The use of UT is universally accepted in the railroad industry as the current best practice. While rail breaks can still occur, even on tracks where UT is performed at a high frequency, a regular UT program helps to minimize the occurrence of revenue service rail breaks and related interference. Research is underway by TTCI and others to improve rail inspection techniques. These include a noncontact testing system capable of testing the entire rail base and another system that uses ultrasonic phased arrays for rail defect detection.
Research by the TTCI and others to improve rail flaw detection is ongoing. The objective is to identify more comprehensive ultrasonic inspection techniques that are capable of inspecting the entire rail base beyond the limitations of the current ultrasonic inspection methods.
1.7.9 Welded rail
The 2 welding procedures most often used to connect rails are thermite welding and flash butt welding. Field welds are increasingly performed using the flash butt welding process, as there are generally fewer defects when using this procedure. In this procedure, the welding machine aligns the rails, presses them end-to-end, and forges the ends together by charging the rails electrically. The upset material produced when the rails are pressed together is sheared off. The head and base of the rail are then ground. The weld geometry is checked using a straightedge and a taper gauge.
1.8 Equipment inspection
At CN's Gordon Yard in Moncton, all cars received a safety inspection by certified car inspectors. In this occurrence, the train received a Number 1 air brake test and a pull-by inspection at the time of departure. In addition to the WILD inspection at Alward, New Brunswick, the train was checked by 13 wayside inspection systemFootnote 11 sites after departing Moncton and before the occurrence. No abnormal conditions were identified during these inspections.
1.9 Recorded information
1.9.1 Download from the locomotive event recorders
A locomotive event recorder (LER) download was obtained from the lead locomotive (CN 2259) and from the DP locomotive (CN 8954).Footnote 12 Appendices A and B summarize the events in the 5 minutes before the derailment.
According to the LER information, the DP locomotive came to rest 6 seconds after the emergency brake application.
1.9.2 Forward-facing video recorders
Both the lead locomotive and the DP locomotive were equipped with forward-facing video recorders. An examination of the video from the DP locomotive (in conjunction with the LER information) revealed the following (Table 7).
| Time | Event | Description |
|---|---|---|
| 1450:05 | First sign of lateral oscillation | First point in the video that showed a sign of lateral oscillation for the 65th car, marshalled ahead of the DP locomotive (AOK 27626). Train speed was 46 mph. |
| 1450:07 | Significant oscillation. Dust seen in foreground beyond DP locomotive | As erratic equipment oscillation became more pronounced, a cloud of dust could be seen in the foreground, beyond the location of the DP locomotive. Train speed was 46 mph. |
| 1450:11 | Emergency audible | Point in the video recording that the activation of the emergency brakes was audible. Train speed was 44 mph. |
| 1450:17 | Equipment at rest | Equipment movement ceased. |
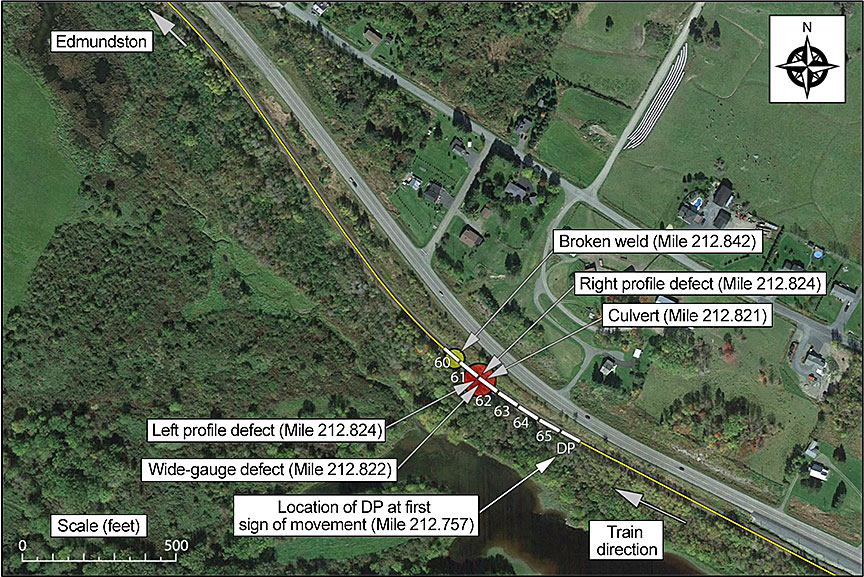
When the first unusual lateral oscillation started, the DP locomotive was located at about Mile 212.75 and the second derailed car at Mile 212.82 (the location where combined gauge and surface conditions were present, as identified by the TEST car inspection). The DP locomotive came to rest approximately 600 feet west of the location where the unusual lateral oscillations began (Figure 7).
1.10 Tank cars
The 20 derailed residue tank cars (last containing petroleum crude oil) were Class 111 tank cars. Seventeen of these tank cars had been built with ½-inch thick steel and were equipped with half-height head shields and brake valves compatible with electronically controlled pneumatic brakes. The other 3 tank cars were jacketed and equipped with full-height head shields.
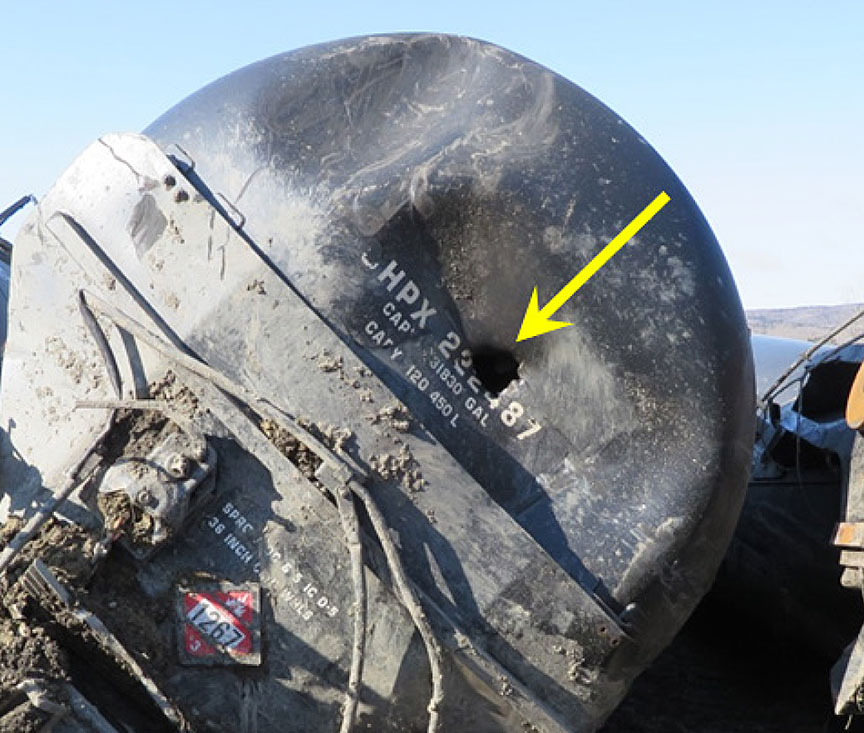
Most of the derailed tank cars were subjected to significant forces during the derailment and when they slid down the embankment. Numerous dents and other deformations were noted in their tank shells and heads as a result of these impacts. One of the tank cars equipped with a half-height head shield experienced a puncture in the unprotected part of the head (Photo 9). There were no leaks, as the derailed cars were not loaded.Footnote 13
1.11 Monitoring systems for railway equipment and track strength
Railways gather information from various wayside and on-board technologies, such as WILDs, wheel-bearing detection systems, and performance-based track geometry inspection systems. Information from these monitoring systems allows the railways to optimize their operations while enhancing safety (for example, by reducing the vehicle/track dynamics and the stress state of the railways).
Gauge restraint measurement systems (GRMS) are one of the more recent technologies. A GRMS is used to determine a track's gauge-restraint capability by inducing a combination of lateral and vertical loads to the rails. These systems assess the ability of the track structure to withstand gauge-widening forces, including evaluation of crosstie condition and tie-fastener performance.
Truck performance detectors and truck hunting detectors are wayside devices that can detect railway trucks exhibiting poor performance in curves. These systems evaluate truck curving performance by measuring such things as lateral and vertical loads, axle angle of attack, axle loads, and truck loads.
In 2015, CN added a deployable GRMS to one of its TEST cars. GRMS and truck performance detectors are not yet in widespread use.
1.12 TSB Watchlist
The TSB Watchlist is a list of issues posing the greatest risk to Canada's transportation system. The TSB publishes the Watchlist to focus the attention of industry and regulators on problems that need addressing.
In 2014, the transportation of flammable liquids by rail was added to the TSB Watchlist. Based on previous investigations, recommendations, and other safety communications, the increase in the transportation of flammable liquids—such as crude oil—by rail across North America has created emerging risks that need to be effectively mitigated. The TSB indicated that railway companies must conduct route planning and analysis, and perform risk assessments to ensure that risk-control measures are effective. The TSB also reiterated that flammable liquids must be shipped in more robust tank carsFootnote 14 to reduce the likelihood of a dangerous-goods release during accidents.
1.13 TSB Laboratory examination of components
Nine pieces of broken rail (including a weld near Mile 212.84) and 2 wheel sets with impact marks were sent to the TSB Laboratory in Ottawa, Ontario.Footnote 15
In addition, the trailing wheel set from the 60th car (CRLE 19431), which was the first car ahead of the derailed cars that gave a high WILD reading while en route to Toronto, was also sent to the TSB Laboratory for examination.
Based on the examination of the rail, it was determined that
- Fractures on the subject rail pieces were consistent with sudden overstress rupture.
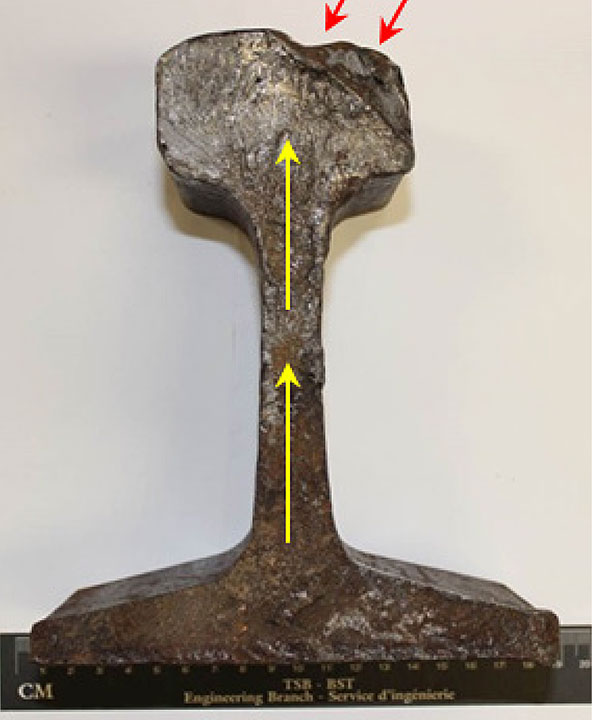
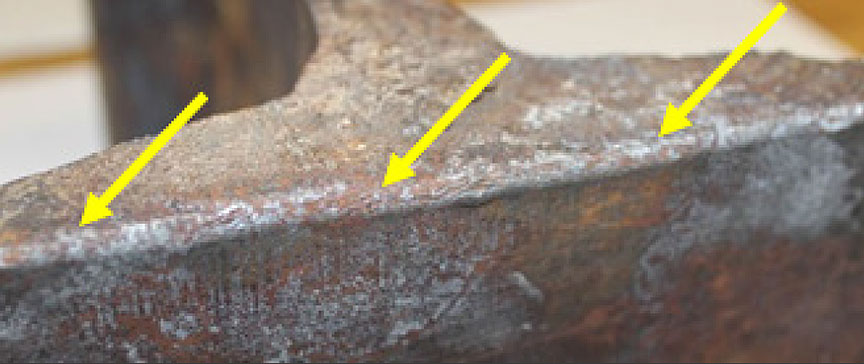
- The fracture surface on rail piece number 9 (Photo 10) indicated that it had broken at a flash butt weld. It exhibited a darker corrosion deposit and rounded edge at the base (Photo 11), suggesting that it had been partially fractured for some time.
- The orientation of chevrons and ridges on the fracture of rail piece number 9 indicated that it had started at the base of the rail and moved upward into the web and head.
- The Sydney rail had significant vertical and gauge wear (Figure 8).

Based on the examination of the wheel sets, it was determined that
- shells observed on the wheel set from non-derailed car CRLE 19431 were within the AAR allowable limits, and
- impact damage that appeared to be fresh was observed on the wheel sets from derailed cars DWC 627099 (Photo 12) and AOK 27626. This damage had likely occurred during the derailment

1.13.1 TSB laboratory reports
The following laboratory reports were completed in support of this investigation:
- LP099/2015 – Examination of Broken Rails
- LP101/2015 – Examination of Railway Wheels
2.0 Analysis
The actions of the train crew were consistent with safe train-handling practices and were not considered contributory to the derailment. The analysis will focus on the track conditions in the vicinity of the occurrence and the condition of the derailed cars ahead of the distributed power (DP) locomotive.
2.1 The derailment
On the basis of the on-board video recorders and the locomotive event recorder (LER) data, it was determined that the DP locomotive was at Mile 212.75 when the first unusual lateral oscillations began. The point of derailment (POD) was determined to be at Mile 212.82, where the combination of gauge and surface conditions had been identified in the track evaluation system (TEST) car inspections. The 2 forward-facing video recorders provided valuable objective data, allowing investigators to better understand the sequence of events leading up to the accident and during the derailment sequence.
The 61st and 62nd cars were at Mile 212.82, where the cloud of dust was noted on the forward-facing video, and were the first cars to derail. Although the trailing end of the 61st car had scuffing on the wheel plates from contact with track ballast, the presence of coupler damage indicated that the 61st car had been pulled over by the 62nd car, which had rotated to the north first.
The marks on the car body of the 62nd car indicated that it moved in a northwest direction relative to its trailing truck. There were corresponding marks on the truck in the direction of movement. The rubbing marks on the outboard tread face of the R-1 wheel on the 62nd car indicated that the wheel was down inside the gauge and had rolled against the north rail. These marks were matched by the scratches on the bottom of the car's truck side frame, which were made when the wheel dropped off the rail. The derailed equipment continued to move until it encountered the partially fractured weld near Mile 212.84. At that point, the rail fractured suddenly and completely owing to high tensile stresses.
Although the train was travelling at 44 mph when the emergency brake application occurred, it came to a stop within about 150 feet. For a heavy train to stop quickly at that speed, the derailed equipment would have had to encounter significant resistance. Such resistance would have occurred when the trailing truck from the 62nd car struck the exposed end of the broken north rail, resulting in the separation of the car from the truck. This would have caused the destruction of the track structure beyond that point. The derailed equipment would then have rolled over on its side, resulting in the abbreviated stopping time and distance.
2.2 Contributions of track conditions
The high rail in the derailment curve had significant gauge face wear. This wear pattern would have resulted in a wheel–rail interface with multiple points of contact. As the wheel–rail contact shifted toward the field side of the rail, the lateral stability of the high rail was reduced. The stability of the rail was further compounded by the track geometry conditions. The equilibrium speed for the curve was 38 mph and as low as 35 mph at the POD. However, the authorized track speed through this curve was 50 mph. Since the curve was slightly underelevated, there was increased lateral loading on the high rail from trains operating within the authorized speed.
Track conditions in the vicinity of the derailment location included track alignment variations and an outward high-rail cant. The most recent TEST car inspection showed that the gauge had reached near-urgent levels and that there were priority surface defects. These track conditions had also been identified during previous TEST car inspections. Although these track conditions had been recurring for some time, no immediate corrective action had been initiated, nor were any required by the TSR or by company instructions.
The tie program in October 2014 had improved rail securement. However, the tie program involved replacement of less than one-third of the overall ties, which were secured with standard spikes. Although the gauge was improved, the placement of the worn south rail resulted in a remaining gauge of about 57 inches. While the gauge was within permissible limits, the subsequent TEST readings were close to the Canadian National Railway (CN) maintenance limit of 57 ¼ inches for priority wide-gauge. The extent of the rail wear on the gauge face essentially reduced the safety factor of the track to protect against gauge-widening forces. If track gauge is close to the maintenance tolerances, the safety factor to protect against incremental gauge-widening forces is reduced, increasing the risk of train derailment.
2.3 Contribution of equipment condition
In addition to the track conditions, the investigation reviewed the condition of the cars ahead of the DP locomotive to determine what role, if any, they may have played in the accident sequence. The uneven marks on the body side bearings of the first 2 derailed cars (the 61st and 62nd cars) suggested that the truck and body bolsters on these cars had been experiencing unequal contact. Although the observed condition of any side bearing may not be a reliable indication of its level of contact, unequal contact can increase truck rotational stiffness, thus contributing to higher lateral loads on the track.
The combination of track conditions and the underelevated curve (that is, for balanced train speed) resulted in a higher lateral loading of the high rail. Higher-than-normal lateral loads can disturb a track, particularly in areas where geometry defects are already present. The higher lateral loading, in conjunction with the reduced lateral stability of the high rail, resulted in the train derailing as it was negotiating the curve. It is unknown to what extent any unequal contact of the side bearing condition may have contributed to the lateral loading of the high rail in the curve.
2.4 Identification of combination track conditions
When inspecting track, the track inspector must have the ability to detect and measure a track condition and must have a specified condemnable limit against which to compare. Within the TSR, it is indicated that combinations of track conditions may need remedial action to provide for safe operations over the track. However, the TSR does not provide specific condemnable limits for what constitutes unsafe combinations of track conditions. For example, there is no guidance with respect to the distance between adjacent defects (that is, to be considered a combination track condition). There is also no guidance if the defects are at the same location.
CN standards mention that certain combination conditions in spirals and curves need attention. However, these standards also do not provide clear condemnable limits for specific combination track conditions (for example, those involving near-urgent and priority defects). In addition, although CN provided its track inspectors with rail wear reports, the locations where rail wear exceeded maximum limits were not specifically identified on the combination defect report.
Since the criteria do not offer a quantifiable “pass” or “fail” standard, inspectors cannot assess combinations of track defects with consistency and accuracy and take the appropriate safety action. Combinations involving priority defects alone are also problematic, as the criteria do not prescribe the timeframe within which corrective action is required. In addition, the inspection required for priority and near-urgent defects is often a visual inspection, which can have limitations. The visual inspection can provide indicators of potential measurement variation under load. However, during a visual inspection, it can be difficult to accurately assess the actual track conditions detected by the TEST car under load.
Providing clear criteria for what constitutes unsafe combinations of conditions and the required remedial action would help improve railway employees' identification and handling of these track conditions. Without clear criteria to address combination conditions that can pose a threat to safe rail operations, there is an increased risk that unsafe combinations of track conditions can be missed or remain unaddressed during track inspections.
2.5 Monitoring systems for railways
Railways supplement their track inspection programFootnote 16 with various technologies. Some examples are wayside inspection systems (such as wheel impact load detectors [WILD] and wheel bearing detection systems) and on-board technologies (such as performance-based track geometry inspection systems). These systems allow the railways to optimize their operations while enhancing safety (for example, by reducing the vehicle/track dynamics and the stress state of the railways).
Other additional technology systems that are available to monitor railways (but are not yet in widespread use) include gauge restraint measurement systems (GRMS), truck performance detectors, and truck hunting detectors. GRMSs are designed to identify locations where the track structure is susceptible to gauge-widening forces.
Railways could further enhance safety by proactively identifying track that may be susceptible to gauge spreading or rail rollover (for example, by using GRMS technology).
2.6 Detection of defects in the base of the rail
During the derailment sequence (that is, as a result of the derailment), the rail broke at a flash butt weld on the north rail. The weld near Mile 212.84 exhibited a darker corrosion deposit and rounded edge at the base of the rail, indicating that it had been partially fractured for some time. The orientation of chevrons and ridges on the surface fracture indicated that the fracture had started at the base of the rail and moved upward into the web and head of the rail. Although this weld was being inspected regularly by ultrasonic testing techniques, the existing defect (the partial fracture) had remained undetected, as it was located in the base of the rail, outside the reflective field of current ultrasonic testing techniques. If a defect exists in the base of the rail, the defect can remain undetected during rail flaw inspections, increasing the risk of a train derailment due to a rail failure.
2.7 Elevated wheel impacts from CRLE 19431
Before the derailment, no wheel impacts greater than the safety thresholds had been recorded for the train. However, the derailment occurred immediately behind a car (CRLE 19431) with a wheel that was subsequently removed in Toronto because of wheel impact levels. This wheel had generated elevated impacts at each successive WILD between Moncton and Toronto. The elevated impacts were recorded on the south rail, which, at the derailment curve, had extensive rail wear, affecting the b/h ratio and thus contributing to reduced stability. The extent to which such minor and non-condemnable wheel impacts may have contributed to the train curving forces on the south rail are unknown, but would likely have been minimal.
As the fractured weld was located on the north rail, the elevated wheel impacts on the south rail from CRLE 19431 did not contribute to the rupture of the weld.
2.8 Protecting tank cars from head punctures during derailments
The puncture in the unprotected part of the head of a tank car fitted with a half-height head shield highlights the benefit of having full head protection on tank cars carrying dangerous goods. If tank cars are not adequately protected using full-height head shields, there is an increased risk of a head puncture during a derailment.
3.0 Findings
3.1 Findings as to causes and contributing factors
- Owing to significant gauge face wear on the high rail, the wheel–rail contact point had been shifting toward the field side, which was reducing the lateral stability of the rail
- A combination of track conditions and a curve underelevated for balanced train speed resulted in a higher lateral loading of the high rail.
- The higher lateral loading, in conjunction with the reduced lateral stability of the high rail, resulted in the train derailing as it was negotiating the curve.
3.2 Findings as to risk
- If track gauge is close to the maintenance tolerances, the safety factor to protect against incremental gauge-widening forces is reduced, increasing the risk of train derailment.
- Without clear criteria to address combination conditions that can pose a threat to safe rail operations, there is an increased risk that unsafe combinations of track conditions can be missed or remain unaddressed during track inspections.
- If a defect exists in the base of the rail, the defect can remain undetected during rail flaw inspections, increasing the risk of a train derailment due to a rail failure
- If tank cars are not adequately protected using full-height head shields, there is an increased risk of a head puncture during a derailment
3.3 Other findings
- The 2 forward-facing video recorders provided valuable objective data, allowing investigators to better understand the sequence of events leading up to the accident and during the derailment sequence.
- Railways could further enhance safety by proactively identifying track that may be susceptible to gauge spreading or rail rollover (for example, by using gauge restraint measurement system technology)
- As the fractured weld was located on the north rail, the elevated wheel impacts on the south rail from car CRLE 19431 did not contribute to the rupture of the weld.
4.0 Safety action
4.1 Safety action taken
4.1.1 Canadian National Railway
In August 2015, Canadian National Railway (CN) reduced the combined wear limit for 136-pound rail to 1 1/8 inches (28 mm) from 1 ¼ inches (31 mm).
CN also added a gauge restraint measurement system (GRMS) to one of its TEST cars to enhance its assessment of the lateral strength of the track structure. CN is using the recorded data to evaluate the utility of GRMS for more widespread use.
4.1.2 Transportation Safety Board of Canada
In February 2016, the Transportation Safety Board of Canada issued Rail Safety Advisory Letter 05/16 to Transport Canada (TC) concerning combination track conditions. The advisory highlighted the limited guidance for track maintenance personnel when dealing with combination conditions. The advisory identified that additional guidance relating to combinations of track conditions, required remedial action, and the timeframe for corrective action, would assist track maintenance personnel with ensuring safe track conditions. The advisory stated that TC may wish to review the guidance provided to track maintenance personnel relating to combination defects, particularly those involving near-urgent defects, to ensure safe operations over the track.
On 30 May 2016, TC responded, stating that the Track Safety Rules are minimum safety requirements and that railways are encouraged to adopt additional or more stringent requirements than those contained in the rules.
This report concludes the Transportation Safety Board's investigation into this occurrence. The Board authorized the release of this report on 10 August 2016. It was officially released on 27 September 2016.
Appendices
Appendix A – Locomotive event recorder data for CN 2259 (lead locomotive)
| Date | Time | Mile | Speed (mph) | Locomotive brake pipe pressure (pounds per square inch) | Locomotive brake cylinder pressure (pounds per square inch) |
Emergency brake | Throttle position | Event |
|---|---|---|---|---|---|---|---|---|
| 17 April 2015 | 1445:00 | 210.33 | 40 | 89 | 0 | off | 5 | Start of recorded information |
| 17 April 2015 | 1445:01 | 210.34 | 40 | 89 | 0 | off | 6 | Throttle to 6th notch |
| 17 April 2015 | 1445:15 | 210.50 | 40 | 89 | 0 | off | 7 | Throttle to 7th notch |
| 17 April 2015 | 1445:33 | 210.70 | 40 | 89 | 0 | off | 8 | Throttle to 8th notch |
| 17 April 2015 | 1448:16 | 212.60 | 43 | 89 | 0 | off | 8 | Last car clears speed restriction |
| 17 April 2015 | 1449:38 | 213.62 | 46 | 89 | 0 | off | 7 | Throttle to 7th notch |
| 17 April 2015 | 1449:56 | 213.85 | 46 | 89 | 0 | off | 6 | Throttle to 6th notch |
| 17 April 2015 | 1450:12 | 214.06 | 44 | 66 | 0 | on | 6 | Emergency brake application |
| 17 April 2015 | 1450:55 | 214.36 | 0 | 0 | 16 | on | idle | Emergency brake application |
Appendix B – Locomotive event recorder data for CN 8954 (distributed power locomotive)
| Date | Time | Mile | Speed (mph) | Locomotive brake pipe pressure (pounds per square inch) | Locomotive brake cylinder pressure (pounds per square inch) |
Emergency brake | Throttle position | Event |
|---|---|---|---|---|---|---|---|---|
| 17 April 2015 | 1445:00 | 209.16 | 40 | 89 | 0 | released | 5 | Start of recorded information |
| 17 April 2015 | 1445:03 | 209.19 | 40 | 89 | 0 | released | 6 | Throttle to 6th notch |
| 17 April 2015 | 1445:18 | 209.36 | 40 | 89 | 0 | released | 7 | Throttle to 7th notch |
| 17 April 2015 | 1445:36 | 209.55 | 40 | 89 | 0 | released | 8 | Throttle to 8th notch |
| 17 April 2015 | 1448:16 | 211.41 | 43 | 89 | 0 | released | 8 | Last car clears speed restriction |
| 17 April 2015 | 1449:41 | 212.46 | 46 | 89 | 0 | released | 7 | Throttle to 7th notch |
| 17 April 2015 | 1449:58 | 212.68 | 46 | 89 | 0 | released | 6 | Throttle to 6th notch |
| 17 April 2015 | 1450:11 | 212.84 | 44 | 66 | 0 | applied | 6 | Emergency brake application |
| 17 April 2015 | 1450:17 | 212.87 | 0 | 0 | 43 | applied | idle | Emergency brake application |